DataViz

Development of a tools set for visualizing data in 2D and 3D formats
The task of the project:
We were to create a convenient data visualization system, which could be applied in different industries and tasks: from basic diagram animation to 3D diagram and map visualization.
Visualization of a big array of quantitative and qualitative data and parameters
Integrating data in one system for the purpose of research, analytics, and providing the user with the possibility of making decisions based on objective data.
Data storytelling is used for arranging the data submission according to a certain scenario, which makes the process of data analysis easier, enables users to reveal trends and patterns, so that visualization may serve as a tool in any sphere.
Specifics of the project:
This is a tool that can be configured and adjusted to different platforms and it involves a set of made-up 2D and 3D visualization samples .
What we did and how we did it:
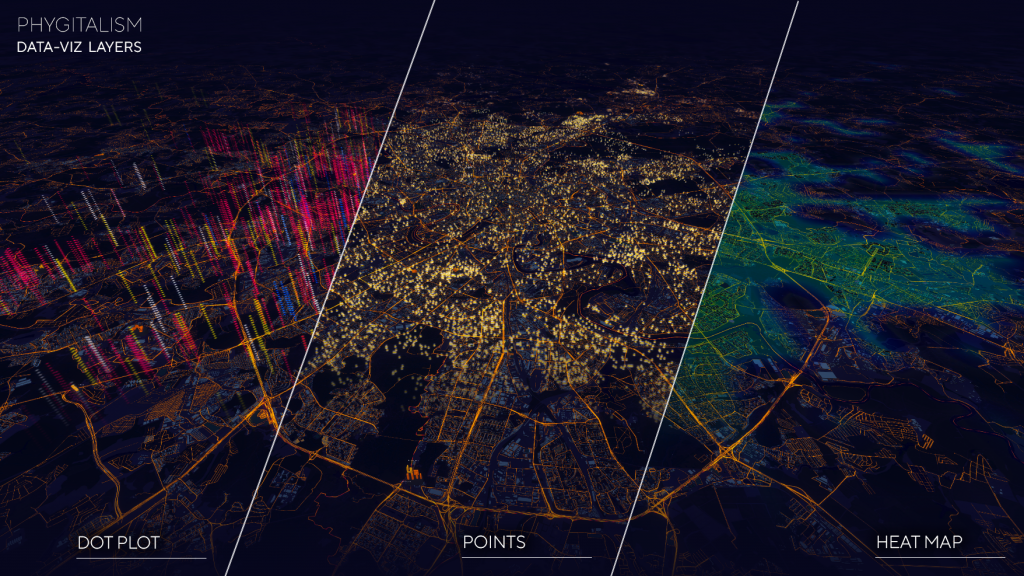
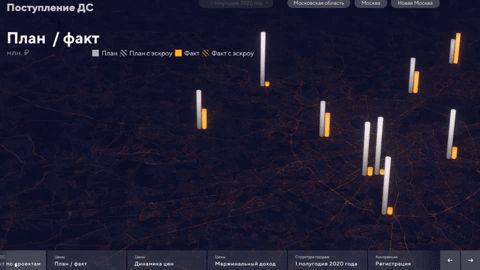
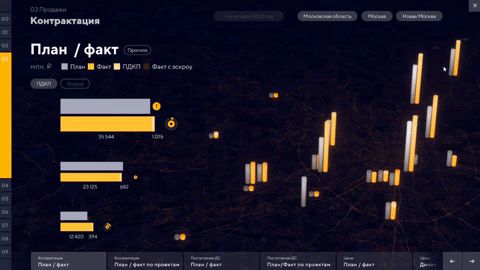
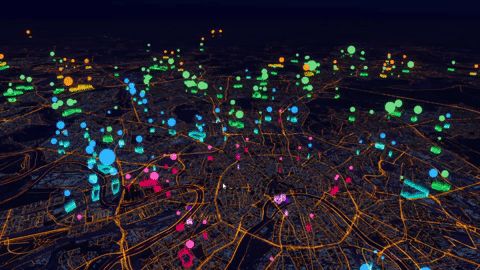
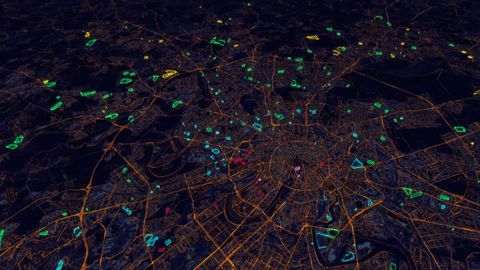
We developed 3D modules, which are ready to be integrated into different platforms. In this case, we are talking about PC-, Web-, VR-, and AR- applications. The solution allowed us to render a large data array in diverse visual content with the help of:
– bars/columns;
– rows/points;
– clusters;
– heatmap.
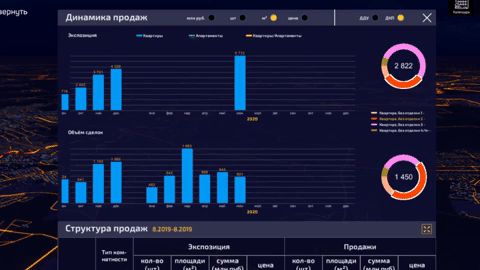
Some portion of information was introduced with a big number of 2D visualizations of the following types:
data charts;
– diagrams: line, cumulative, normalized, layered;
– schemes;
– maps;
– infographics.
Year of the project implementation: 2020